Interest rates on farm loans increased sharply in the third quarter and the acceleration in farm real estate values continued to ease. Farm income and credit conditions remained solid, but the pace of improvement softened. The financial impact of drought also intensified, particularly in the southern and western portions of the District. Despite recent headwinds, farm finances remained strong and continued to support sound agricultural loan performance.

The outlook for the agricultural economy generally has remained positive despite a recent pull back in prices of some key farm commodities. Volatility in crop markets, higher expenses and drought could hinder incomes for some producers, but prices of key crops and livestock remained at multi-year highs and profit opportunities across the farm sector remained favorable. The substantial improvement in farm finances and a surge in agricultural real estate values over the past two years have also bolstered balance sheets and continued to provide ongoing support to many operations.

Interest Rates and Farmland Values

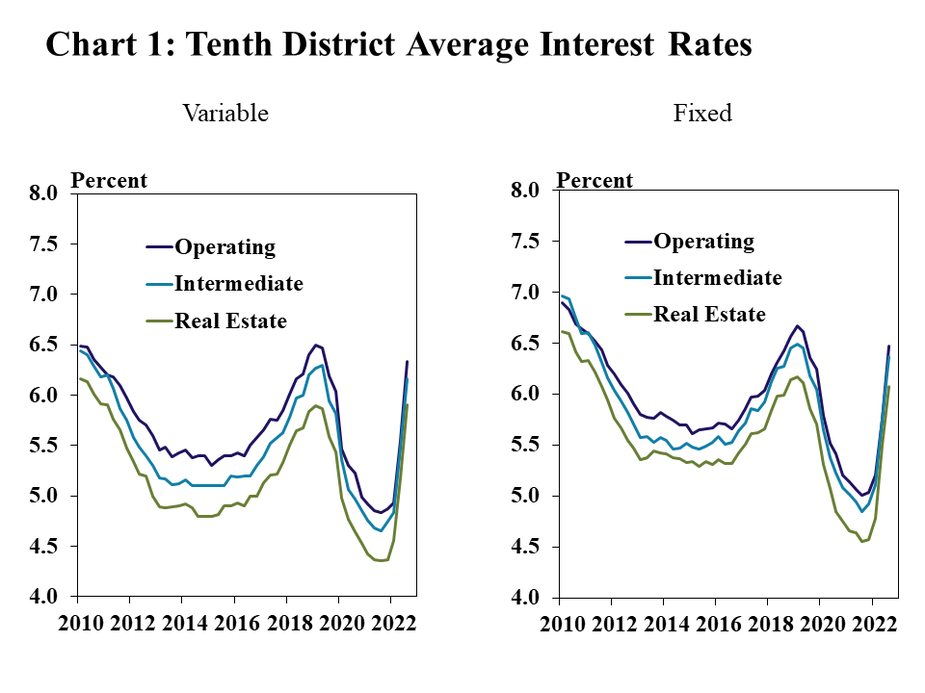
The average rate charged on farm loans rose rapidly alongside higher benchmark rates. Variable and fixed rates on all types of loans were about 75 and 65 basis points higher than last quarter, respectively (Chart 1). Farm banks have increased rates alongside the historically sharp rise in the federal funds rate and financing costs for farmers have reached the highest level since 2019.

Chart 1: Tenth District Average Interest Rates – includes two individual charts. Left, Fixed- is a line graph showing the average fixed interest rate for operating, intermediate and real estate loans in each quarter from Q1 2010 to Q3 2022. Right, Variable- is a line graph showing the average variable interest rate for operating, intermediate and real estate loans in each quarter from Q1 2010 to Q3 2022.

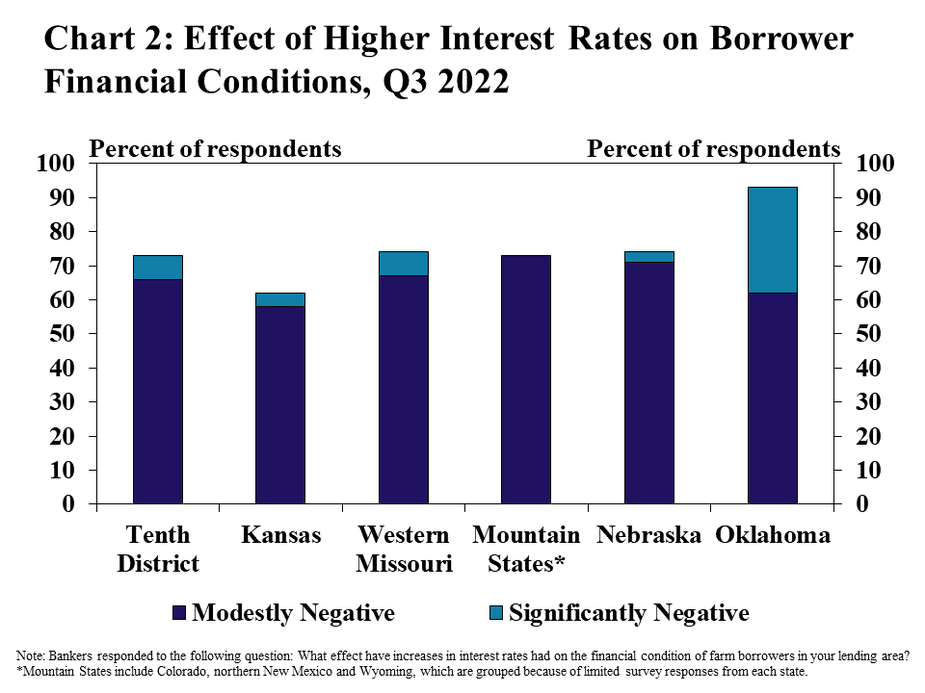
Higher interest rates have had a direct impact on farm borrowers according to lenders. About two thirds of respondents in the District indicated that higher interest rates had a negative effect on financial conditions for borrowers (Chart 2). Banks in Oklahoma noticed the most pronounced impact, with about a third reporting a significant negative effect.

Chart 2: Effect of Higher Interest Rates on Borrower Financial Conditions, Q3 2022- is stacked column chart showing the percent of respondents that reported the impact of higher interest rate on financial conditions for farm operations in their area has been a Modestly Negative and a Significantly Negative. It includes bars for the Tenth District and each state.  Note: Bankers responded to the following questions: What effect have increases in interest rates had on the financial condition of farm borrowers in your lending area? *Mountain States include Colorado, northern New Mexico and Wyoming, which are grouped because of limited survey responses from each state.

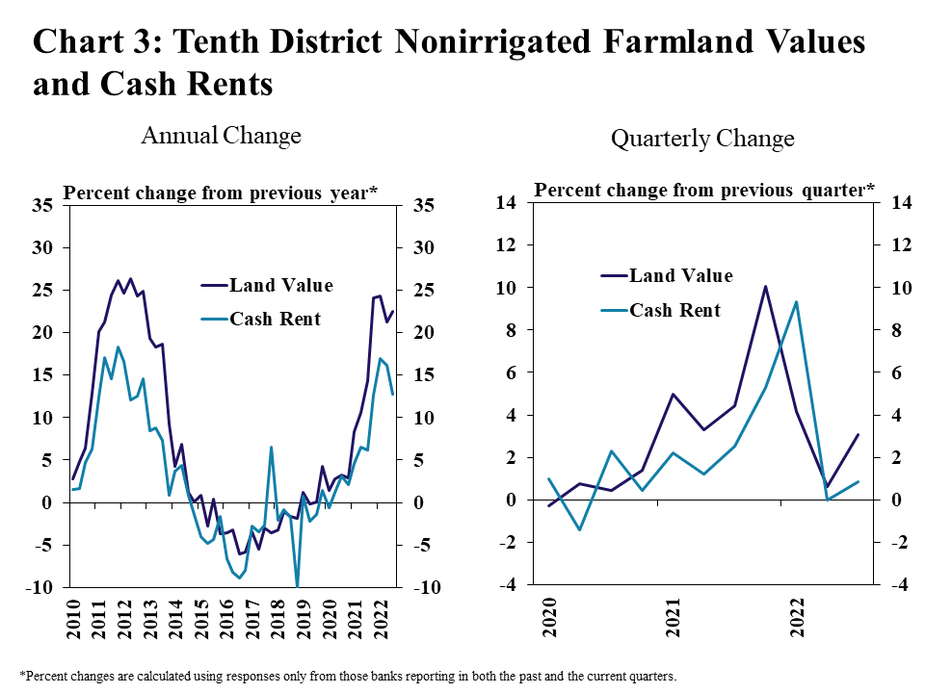
As interest rates increased, growth in farm real estate values showed more signs of softening. The value of nonirrigated farmland increased about 23% and 3% from the previous year and quarter, respectively (Chart 3). The pace of growth has moderated following steep acceleration in 2021 and cash rental rates have also followed a similar path.

Note: Bankers responded to the following questions: What effect have increases in interest rates had on the financial condition of farm borrowers in your lending area? *Mountain States include Colorado, northern New Mexico and Wyoming, which are grouped because of limited survey responses from each state.

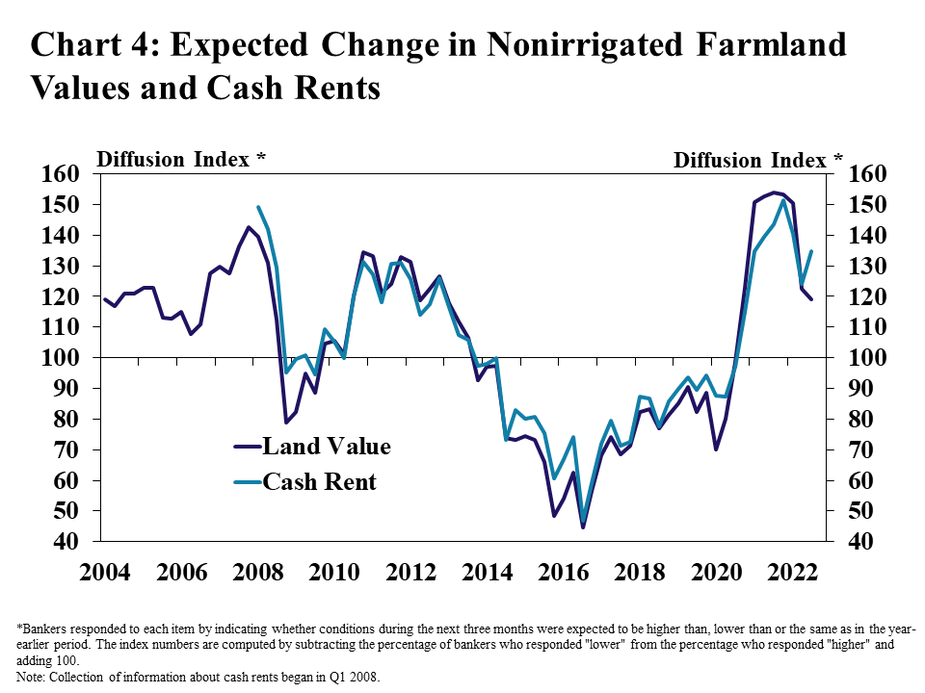
Additional growth in farmland values and cash rents was still anticipated in the coming months, but the expected pace of increase continued to moderate. About 30% of banks expected farmland values to increase in the next quarter compared with a year earlier, down from about half of respondents expecting future increases throughout 2021 (Chart 4). The share expecting higher cash rents increased slightly from last quarter, but also remained below the average of 2021.

Chart 4: Expected Change in Nonirrigated Farmland Values and Cash Rents – is a line graph showing the diffusion index* of the expected change in farmland values and cash rents during the next three months from Q1 2004 to Q3 2022.   *Bankers responded to each item by indicating whether conditions during the next three months were expected to be higher than, lower than or the same as in the year-earlier period.  The index numbers are computed by subtracting the percentage of bankers who responded "lower" from the percentage who responded "higher" and adding 100. Note: Collection of information about cash rents began in Q1 2008.

Farm Finances, Credit Conditions and Drought

Farm finances remained strong, but increases in income and liquidity were less pronounced than recent quarters. As the price of several major commodities declined from recent highs, farm income increased at a notably slower pace and borrower liquidity was steady compared with a year ago (Chart 5). Looking ahead, income was expected to remain unchanged and cash flow was expected to weaken slightly.

Chart 5: Tenth District Farm Income and Borrower Liquidity– is a line graph showing the diffusion index* of farm income and borrower liquidity in the Tenth District and an index of Agricultural Commodity Prices** in each quarter from Q1 2015 to Q3 2022 and the expectation of farm income and borrower liquidity for the next quarter.   *Bankers responded to each item by indicating whether conditions during the current quarter were higher than, lower than or the same as in the year-earlier period. The index numbers are computed by subtracting the percentage of bankers who responded "lower" from the percentage who responded "higher" and adding 100. **Average of individual indices for spot prices of corn, soybeans, wheat, cattle and hogs. Note: Collection of information about Farm Borrower Liquidity began in Q2 2020. Sources: Wall Street Journal and Haver Analytics.

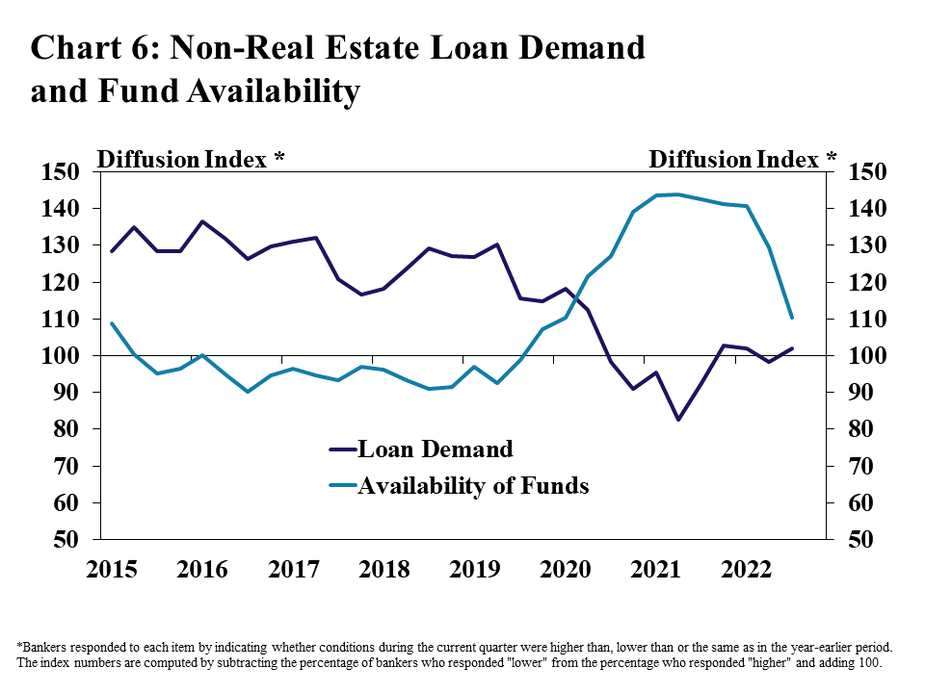
Increases in fund availability slowed alongside moderation in borrower liquidity and steady loan demand. Demand for non-real estate farm loans was nearly unchanged from a year ago, with about 30% of banks reporting higher demand and 30% reporting demand was lower (Chart 6). After surging alongside an influx of deposits the past two years, availability of funds has increased at a notably slower pace in recent quarters.

Chart 6: Non-Real Estate Loan Demand and Fund Availability– is a line graph showing the diffusion index* of farm loan demand and availability of funds in the Tenth District in each quarter from Q1 2015 to Q3 2022.  *Bankers responded to each item by indicating whether conditions during the current quarter were higher than, lower than or the same as in the year-earlier period. The index numbers are computed by subtracting the percentage of bankers who responded "lower" from the percentage who responded "higher" and adding 100.

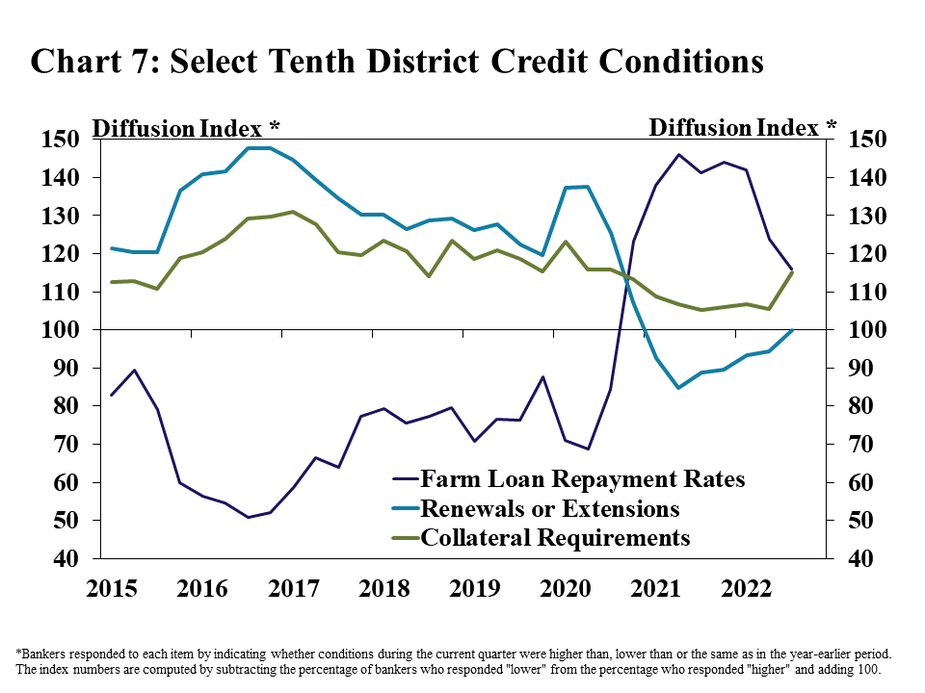
Similar to farm income, key measures of credit conditions remained strong, but improvements were more limited in the third quarter. Farm loan repayment rates continued to increase, but the pace of improvement slowed (Chart 7). At the same time, collateral requirements increased at a slightly faster pace than recent quarters and renewal and extension activity moderated following more than a year of declines.

Chart 7: Select Tenth District Credit Conditions– is a line graph showing the diffusion index* of farm loan repayment rates, renewals or extensions and collateral requirements in the Tenth District in each quarter from Q1 2015 to Q3 2022.  *Bankers responded to each item by indicating whether conditions during the current quarter were higher than, lower than or the same as in the year-earlier period. The index numbers are computed by subtracting the percentage of bankers who responded "lower" from the percentage who responded "higher" and adding 100.

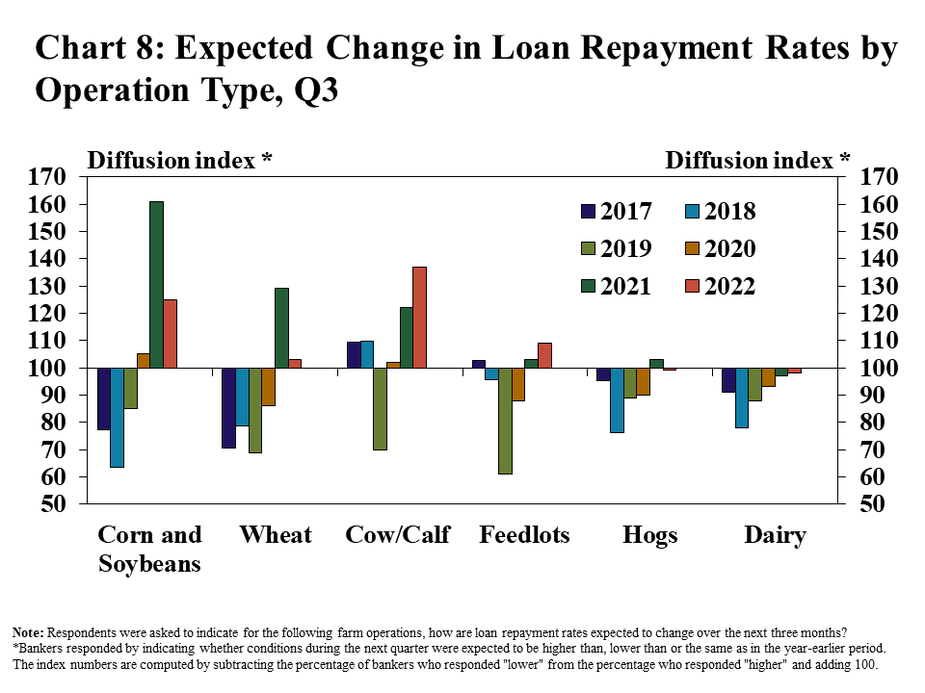
Credit conditions for most types of farm operations were expected to improve slightly or remain steady in the coming months. Farm loan repayment rates for crop farmers were expected to increase further in the next three months, but at a slower pace than last year (Chart 8). Bankers anticipated repayment for borrowers in the cattle industry to improve at a faster rate than last year, while conditions for hog and dairy producers were expected to be mostly steady.

Chart 8: Expected Change in Loan Repayment Rates by Operation Type, Q3 - is a clustered column chart showing the expected diffusion index* of farm loan repayment rates in the next three months for the following types of farm operations: Corn and Soybeans, Wheat, Cow/Calf, Feedlots, Hogs and Dairy. It includes columns for 2018, 2019, 2020, 2021 and 2022.    Note: Respondents were asked to indicate for the following farm operations, how are loan repayment rates expected to change over the next three months? *Bankers responded by indicating whether conditions during the next quarter were expected to be higher than, lower than or the same as in the year-earlier period. The index numbers are computed by subtracting the percentage of bankers who responded "lower" from the percentage who responded "higher" and adding 100.

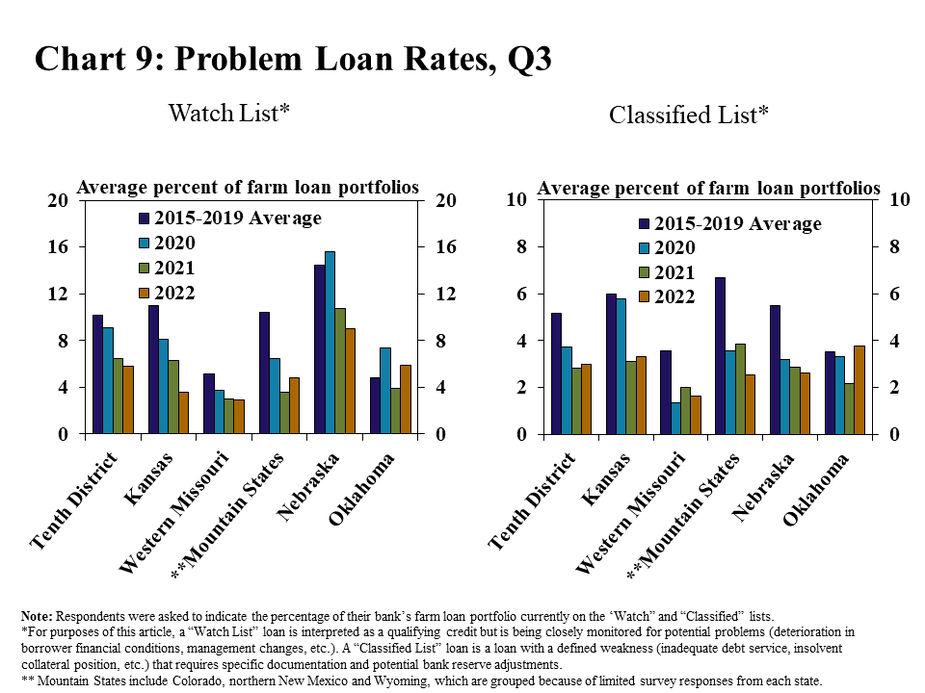
With consistent improvement in repayment, problem loan rates remained low across the District. About 6% and 3% of farm loan volumes through the region were on the watch list or considered classified, respectively, as of the third quarter (Chart 9). The share of portfolios with repayment issues declined slightly or remained the same as a year ago in most states, but increased slightly in Oklahoma, where the farm economy has diverged from surrounding states.

Chart 9: Problem Loan Rates, Q3- includes two individual charts. Left, Watch List* - is a clustered column chart showing average percent of farm loan portfolios currently on the watchlist for the Tenth District and each state. Right, Classified List* - is a clustered column chart showing average percent of farm loan portfolios currently on the classified list for the Tenth District and each state. Both charts include columns for the 2015-2019 average, 2020, 2021 and 2022.   *For purposes of this article, a “Watch List” loan is interpreted as a qualifying credit but is being closely monitored for potential problems (deterioration in borrower financial conditions, management changes, etc.). A “Classified List” loan is a loan with a defined weakness (inadequate debt service, insolvent collateral position, etc.) that requires specific documentation and potential bank reserve adjustments. Note: Respondents were asked to indicate the percentage of their bank’s farm loan portfolio currently on the ‘Watch” and “Classified” lists. ** Mountain States include Colorado, northern New Mexico and Wyoming, which are grouped because of limited survey responses from each state.

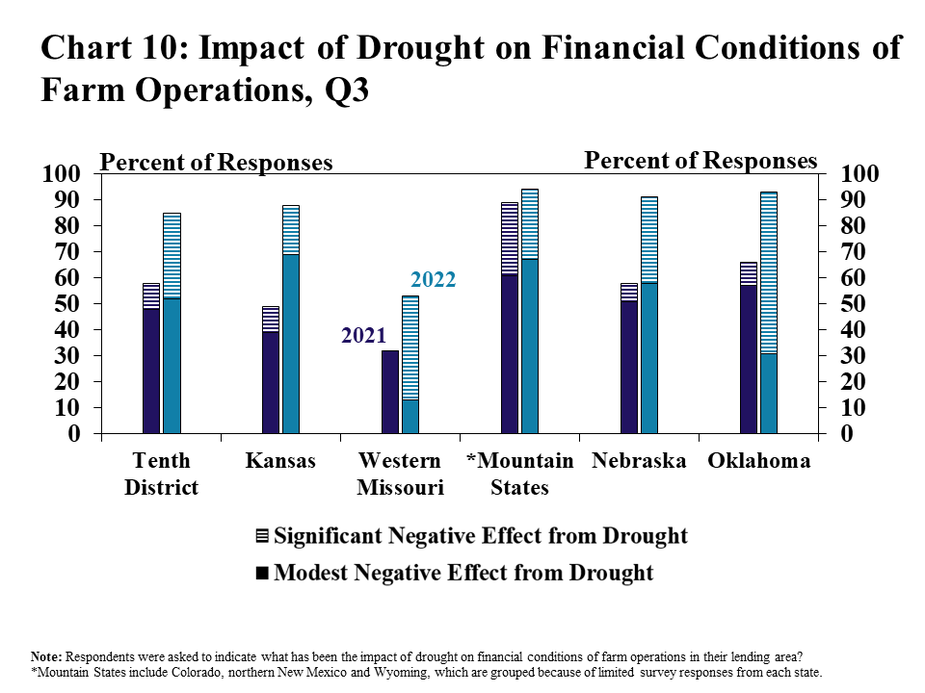
Despite strong conditions in the broad farm economy, persistent drought throughout large portions of the District intensified concerns about financial impacts. As conditions have worsened, the share of banks reporting a modest and significant impact of drought increased from a year ago to about 50% and 35%, respectively (Chart 10). Conditions were comparatively worse in some areas of the District, particularly in Oklahoma, where 60% of bankers reported that the impact of drought was significant.

Chart 10: Impact of Drought on Financial Conditions of Farm Operations, Q3- is clustered, stacked column chart showing the percent of respondents that reported the impact of drought on financial conditions of farm operations in their area has been a Modest Negative Effect from Drought and a Significant Negative Effect from Drought for the Tenth District and each state in 2021 and 2022.  Note: Respondents were asked to indicate what has been the impact of drought on financial conditions of farm operations in their lending area? *Mountain States include Colorado, northern New Mexico and Wyoming, which are grouped because of limited survey responses from each state.

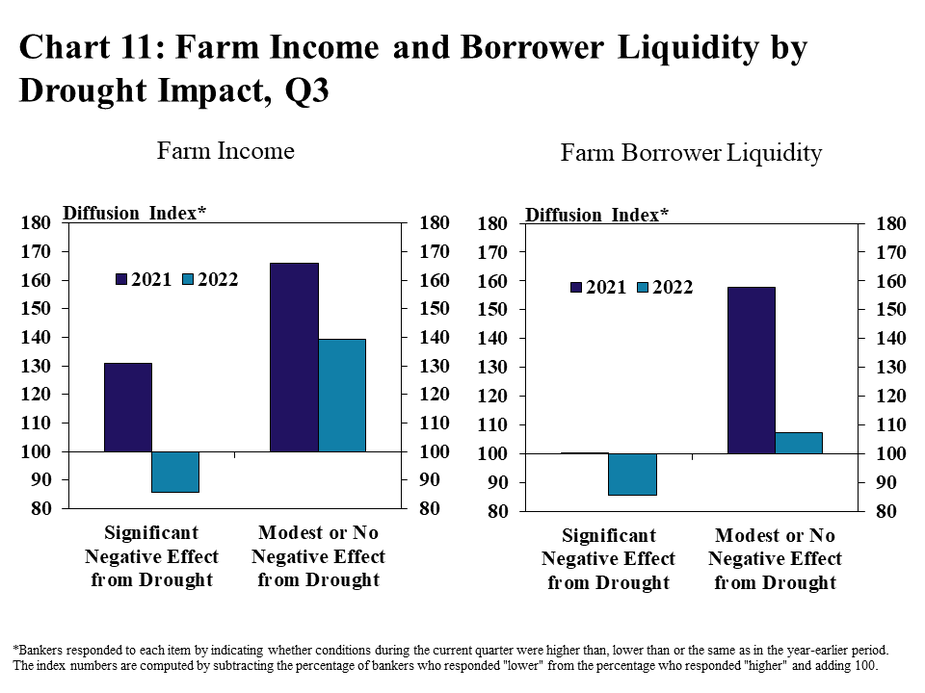
As drought has persisted over the past year, farm finances weakened in areas most impacted. In contrast to the same time a year ago, banks reporting a significant effect of drought also reported that farm income and borrower liquidity was lower than a year ago (Chart 11). Respondents who described the effect as modest continued to report strong conditions, but a slower pace of improvement.

Chart 11: Farm Income and Loan Repayment Rates by Drought Impact, Q3- includes two individual charts. Left, Farm Income - is a clustered column chart showing the diffusion index* of farm income in 2021 and 2022 based on whether the respondent reported Significant Negative Effect from Drought or Modest or No Negative Effect from Drought. Right, Farm Borrower Liquidity - is a clustered column chart showing the diffusion index* of farm borrower liquidity in 2021 and 2022 based on whether the respondent reported Significant Negative Effect from Drought or Modest or No Negative Effect from Drought.  *Bankers responded to each item by indicating whether conditions during the current quarter were higher than, lower than or the same as in the year-earlier period.  The index numbers are computed by subtracting the percentage of bankers who responded "lower" from the percentage who responded "higher" and adding 100.

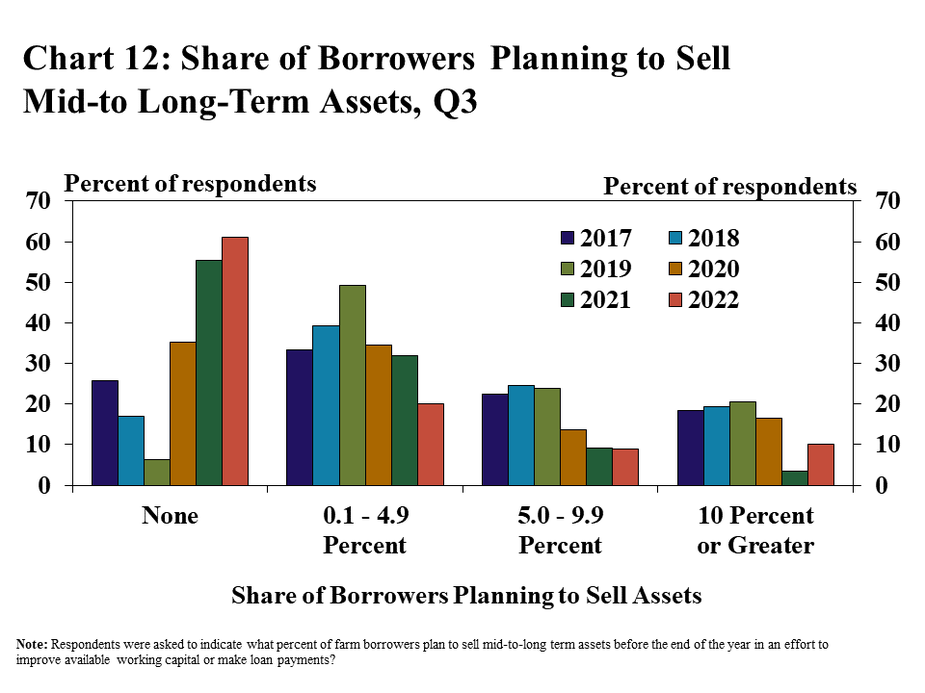
Asset liquidation was notably more prevalent in areas most heavily impacted by drought. The share of banks reporting sales of assets to improve financial positions declined for the third consecutive year, with almost two thirds of respondents reporting no liquidation (Chart 12). However, a slightly larger share of banks reported more than 10 percent of borrowers made sales to help with cash flow and all were located within areas of the District with the most severe drought conditions.

Chart 12: Share of Borrowers Planning to Sell Mid-to Long-Term Assets, Q3 – - is a clustered column chart showing the percent of respondents in the Tenth District that reported various of levels of farm borrowers that plan to liquidate assets. The vertical axis is the percent of respondents, and the horizontal axis is the share of borrowers planning to sell assets (None, 0.1 to 4.9 Percent, 5.0 to 9.9 Percent and 10 Percent or Greater). Each of the horizontal axis categories includes columns for 2017, 2018, 2019, 2020, 2021 and 2022.    Note: Respondents were asked to indicate what percent of farm borrowers plan to sell mid-to-long term assets before the end of the year in an effort to improve available working capital or make loan payments.

Banker Comments Q3 2022

“Uncertainty seems to be a major attitude right now. Livestock prices remain very good, but inputs such as hay and fertilizer are really high.” – Southeast Kansas

“The drought will significantly reduce yields and income and increasing interest rates will add to the negative impact. But most farmers have equity to help them get through this tough period.”– Central Missouri

“This is going to be a very challenging financial situation for small farmers going into 2023 with inflation, high interest rates, volatile markets, and extremely high input costs. Many of the producers in our area are very concerned.”– Southwest Oklahoma

“Drought has been and will continue to be a huge concern for the 2022 and 2023. Pastures are dry, livestock is coming into the feedlots earlier, it’s creating more feed expense and in some cases liquidation of cow herds.”– Northwest Nebraska

“Increased input costs are concerning and the ability of historically strong prices to maintain profitability is being closely monitored.”– Northeast Kansas

“Weather has been very favorable in our area which has led to what is expected to be an excellent crop year, but input costs remain a drag on the net income outlook moving into 2023.”– Northwest Missouri

“Drought has been a problem in our area, but prices will make up for any short yields and most of our farm customers are still projected to have a good year financially despite drought and inflationary costs.”– Northeast Nebraska

“The ongoing drought in Oklahoma is somewhat of a concern that we will see similar drought conditions to Texas and the overall inflationary impact is affecting living expenses.” Southern Oklahoma

Data: Excel SpreadsheetCredit Conditions | Excel SpreadsheetFixed Interest Rates | Excel SpreadsheetVariable Interest Rates | Excel SpreadsheetLand Values

A total of 110 banks responded to the Third Quarter Survey of Agricultural Credit Conditions in the Tenth Federal Reserve District—an area that includes Colorado, Kansas, Nebraska, Oklahoma, Wyoming, the northern half of New Mexico and the western third of Missouri.

The views expressed are those of the authors and do not necessarily reflect the positions of the Federal Reserve Bank of Kansas City or the Federal Reserve System.

Authors

Nate Kauffman

Senior Vice President, Economist, and Omaha Branch Executive

Nate Kauffman is Senior Vice President and Omaha Branch Executive at the Federal Reserve Bank of Kansas City. In his role as the Kansas City Fed's lead economist and represe…

Ty Kreitman

Associate Economist

Ty Kreitman is an associate economist in the Regional Affairs Department at the Omaha Branch of the Federal Reserve Bank of Kansas City. In this role, he primarily supports the F…